American Population
keywords: *ref_0
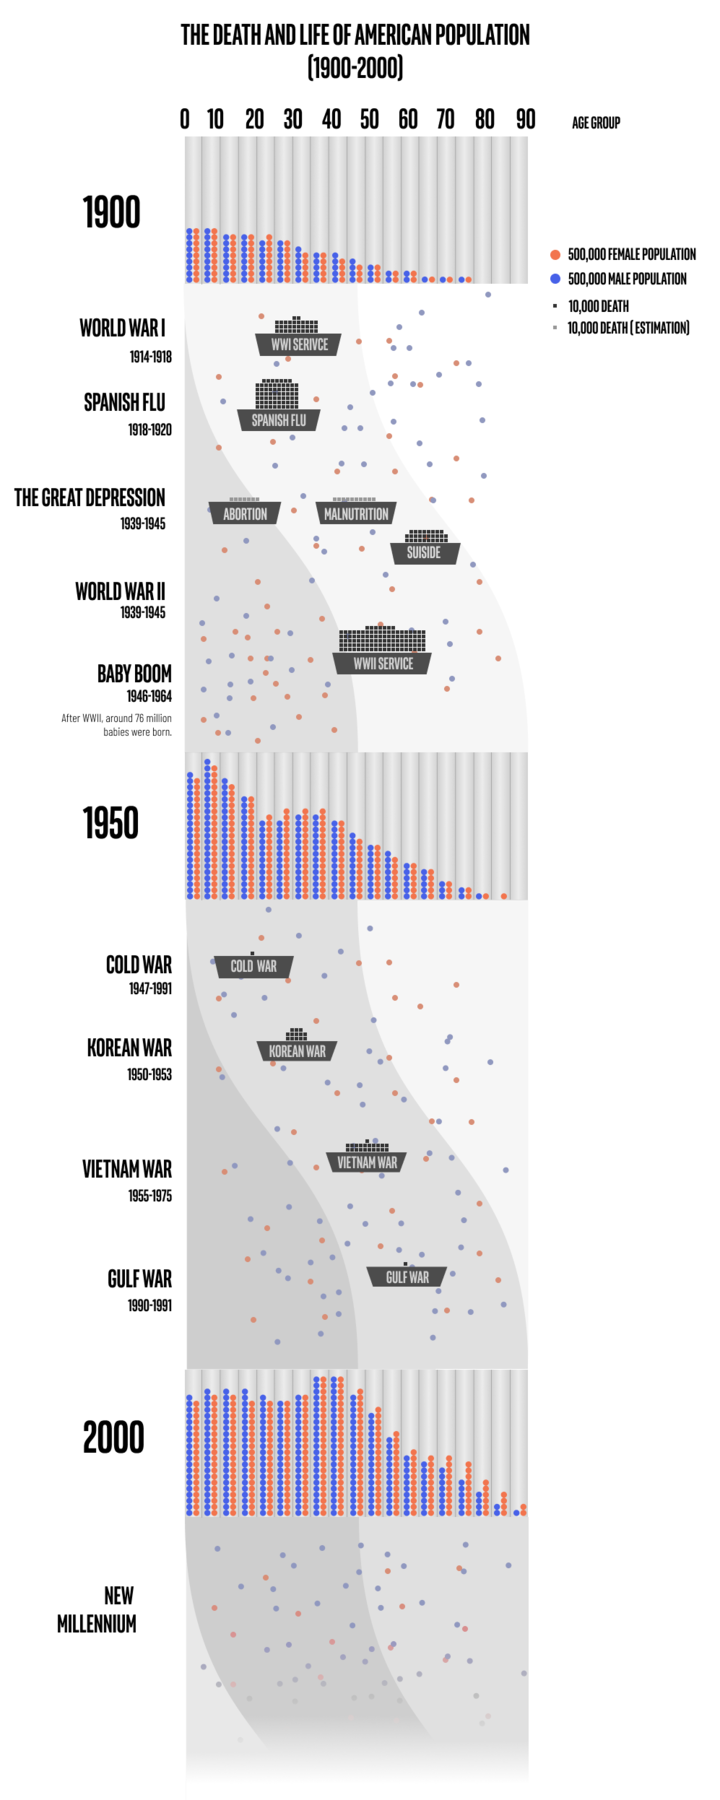
The 20th century was a period of profound transformation for the United States, marked by significant population growth influenced by both internal developments and global events. This visualization aims to show the dramatic changes in the US population due to the impacts of major events that occurred during the 20th century.
Design-Research Question
Can we use visualization to express the continuous process of history, bridging the gap between population starting and ending points through intermediate stages and mortality statistics?
Design Rationale: The 20th Century Pinball Machine
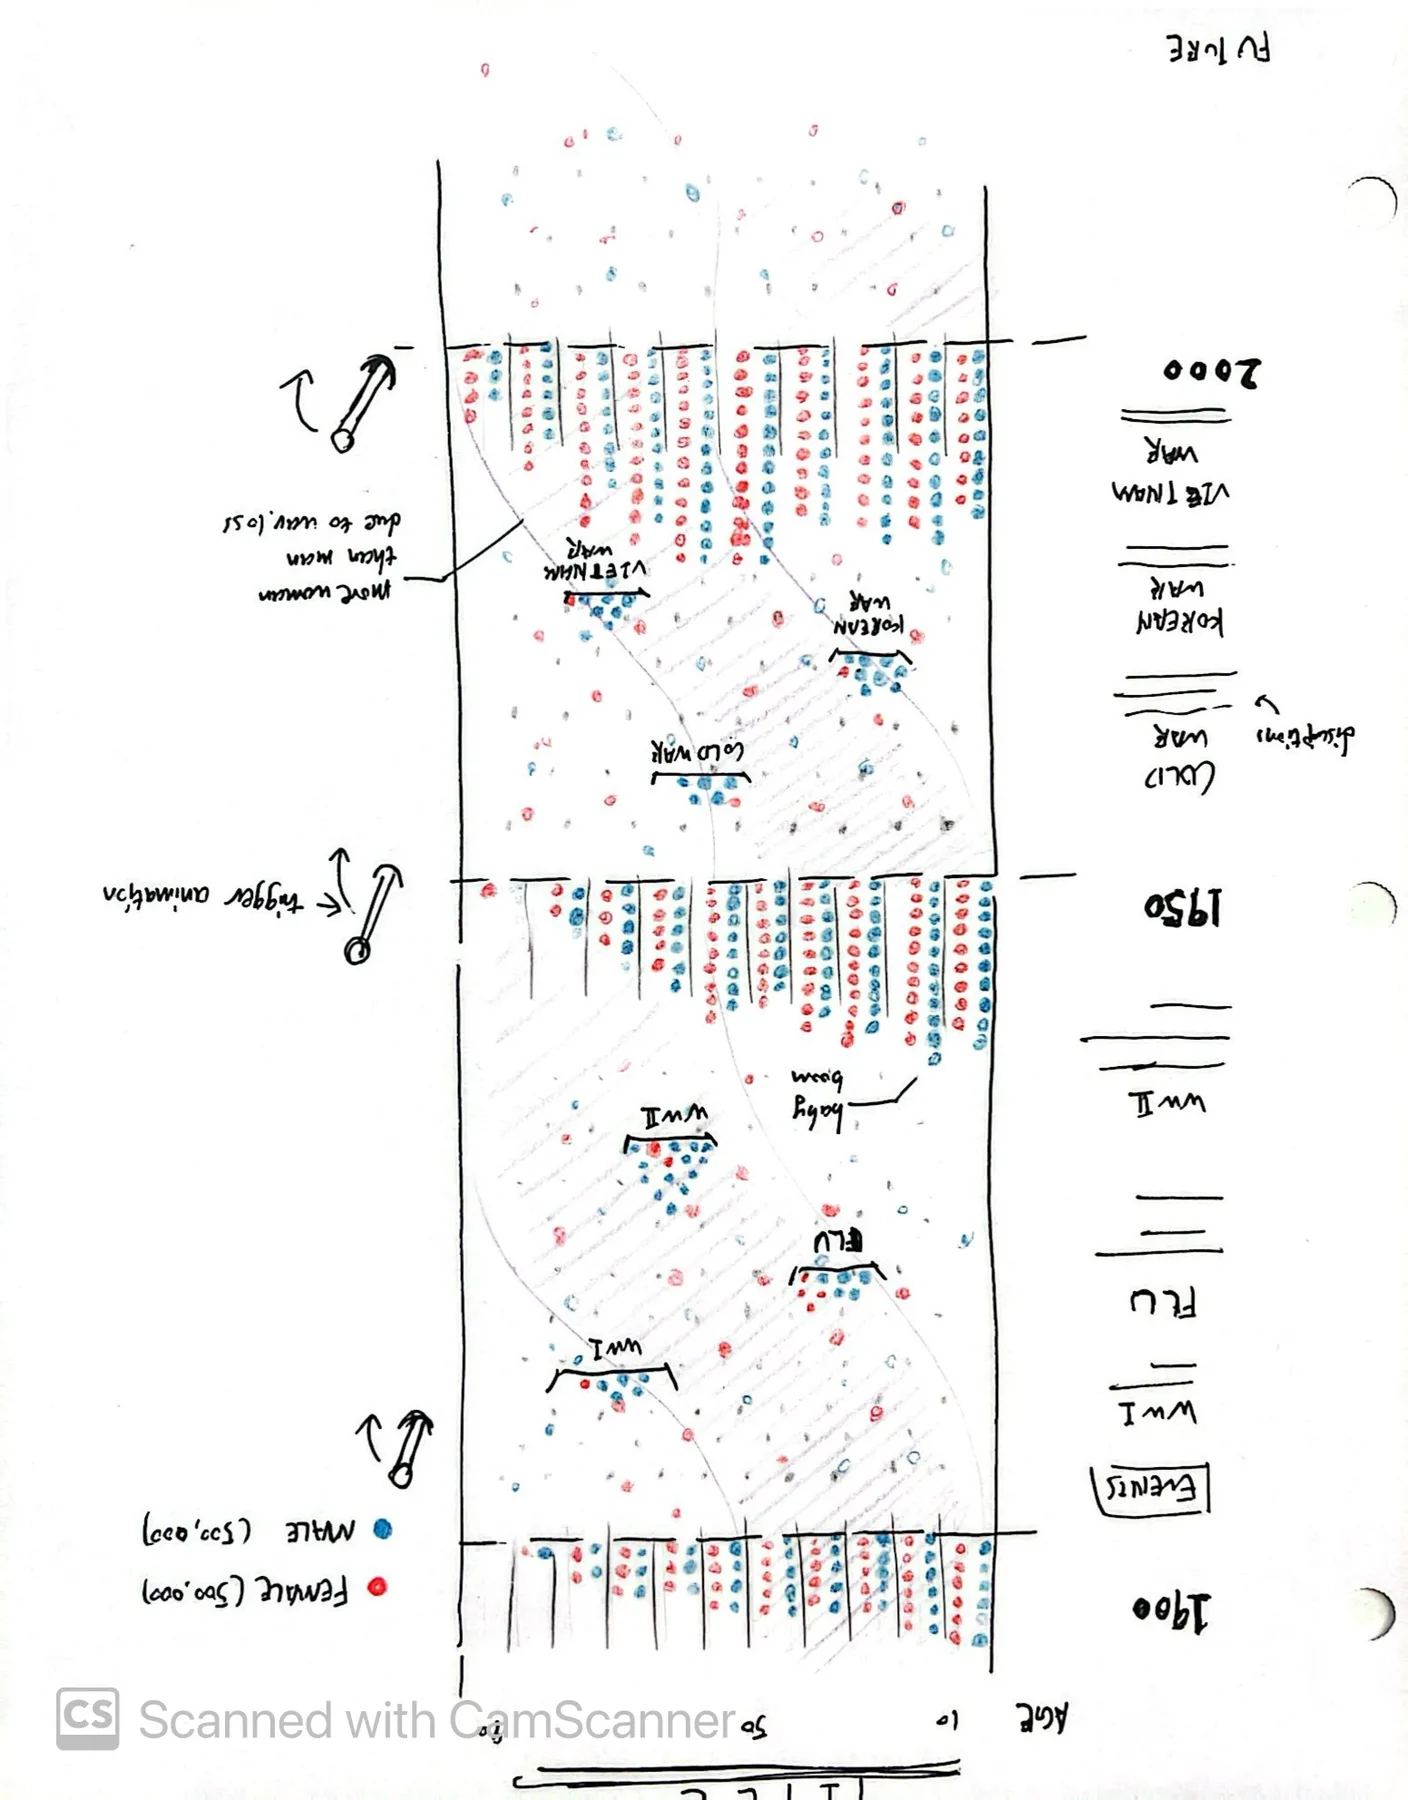
Inspired by the Galton Board, this visualization transforms the binomial distribution process into an arcade game metaphor.
- Gamified visualization: Expresses the randomness of history and the unpredictable outcomes of human lives through the form of a pinball machine.
- Abstract & Symbolic: Different baskets represent historical events (Wars, Great Depression, Baby Boom) that act as "population catchers."
Phase One: Sketching & Exploration
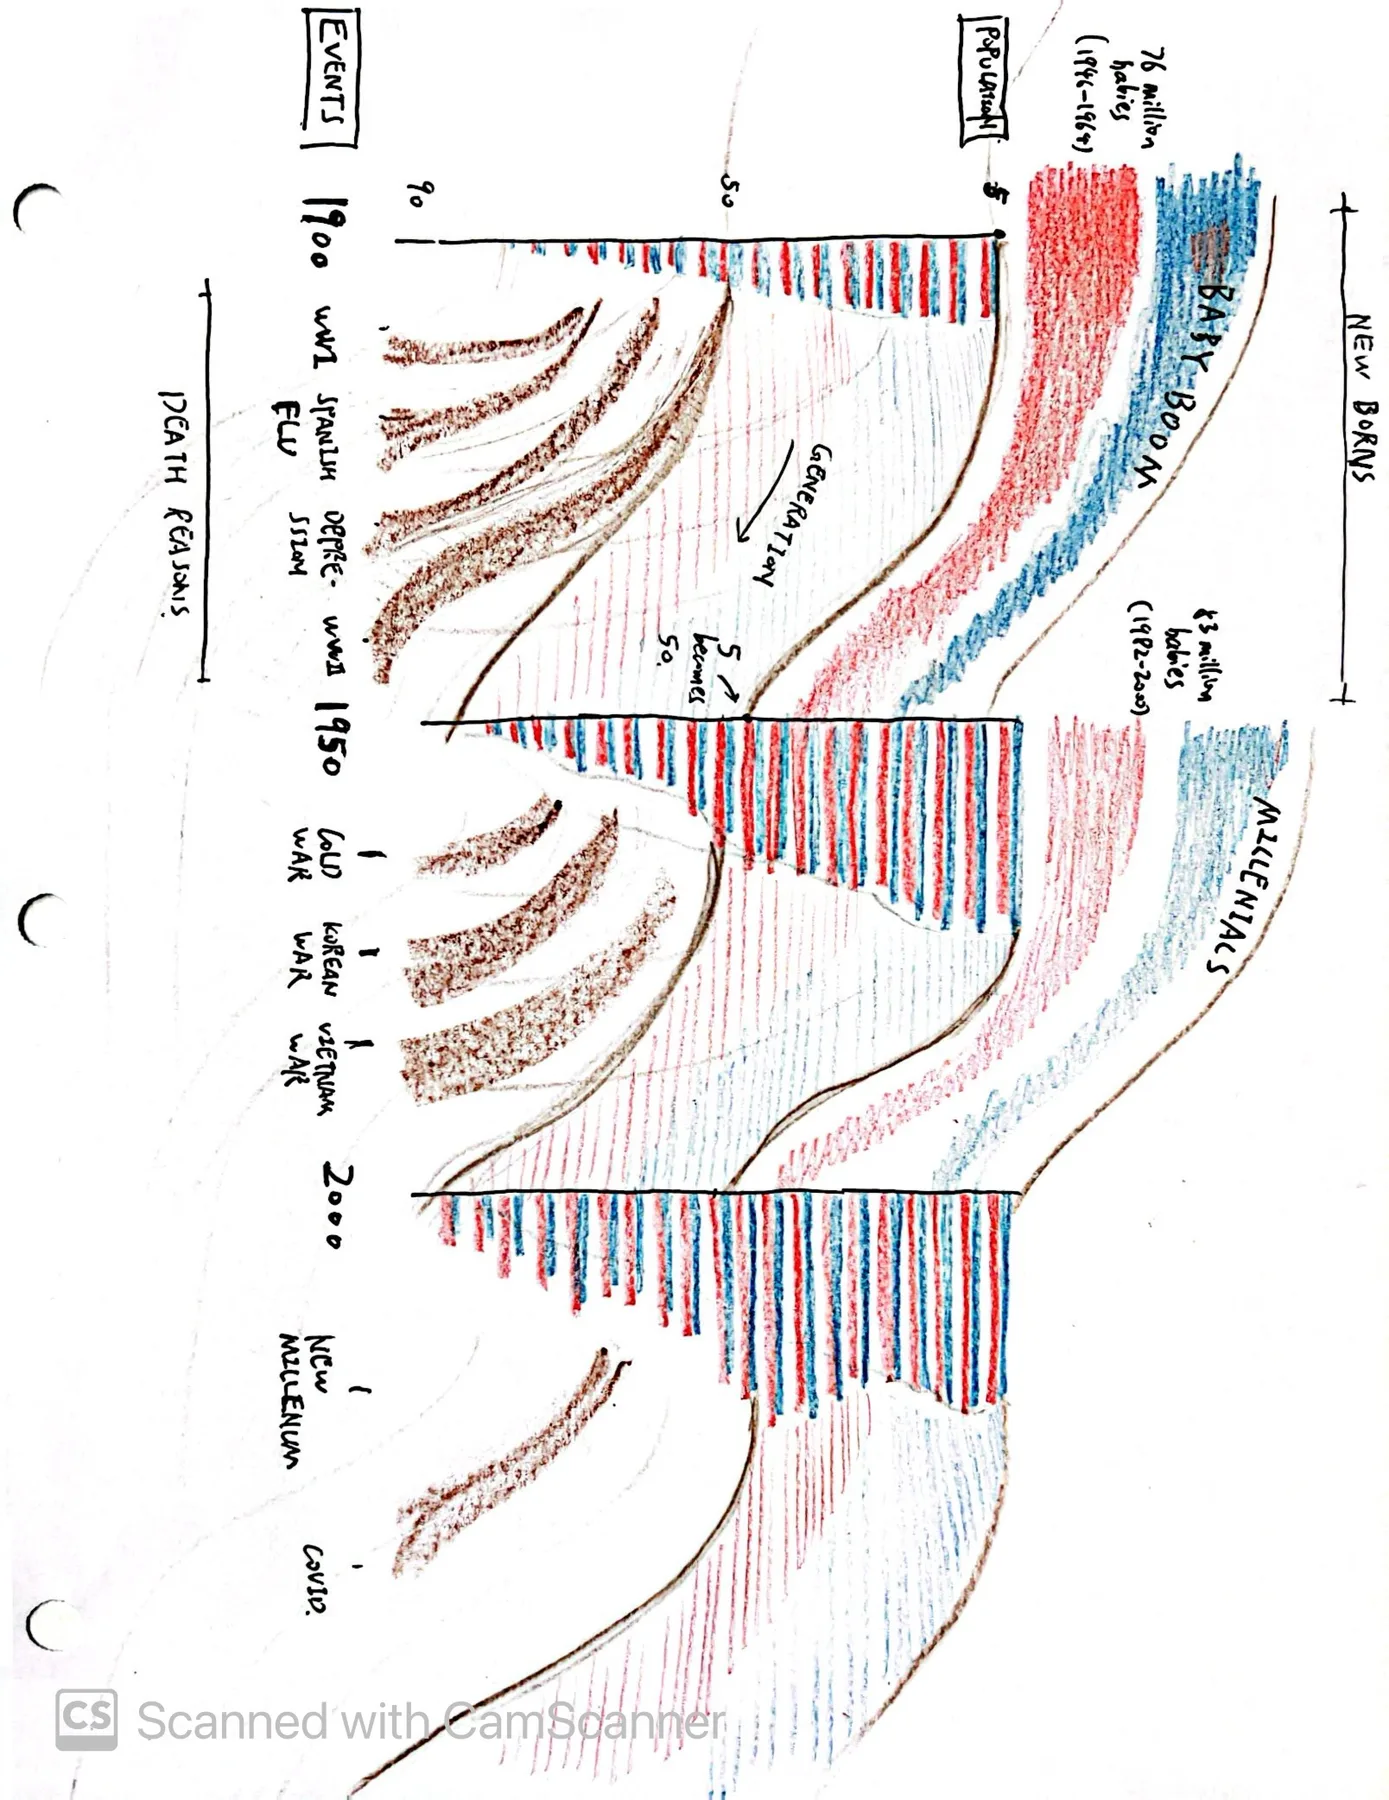
Sketch 1: Modified Sankey Diagram
Focuses on the flow between three interconnected generations.
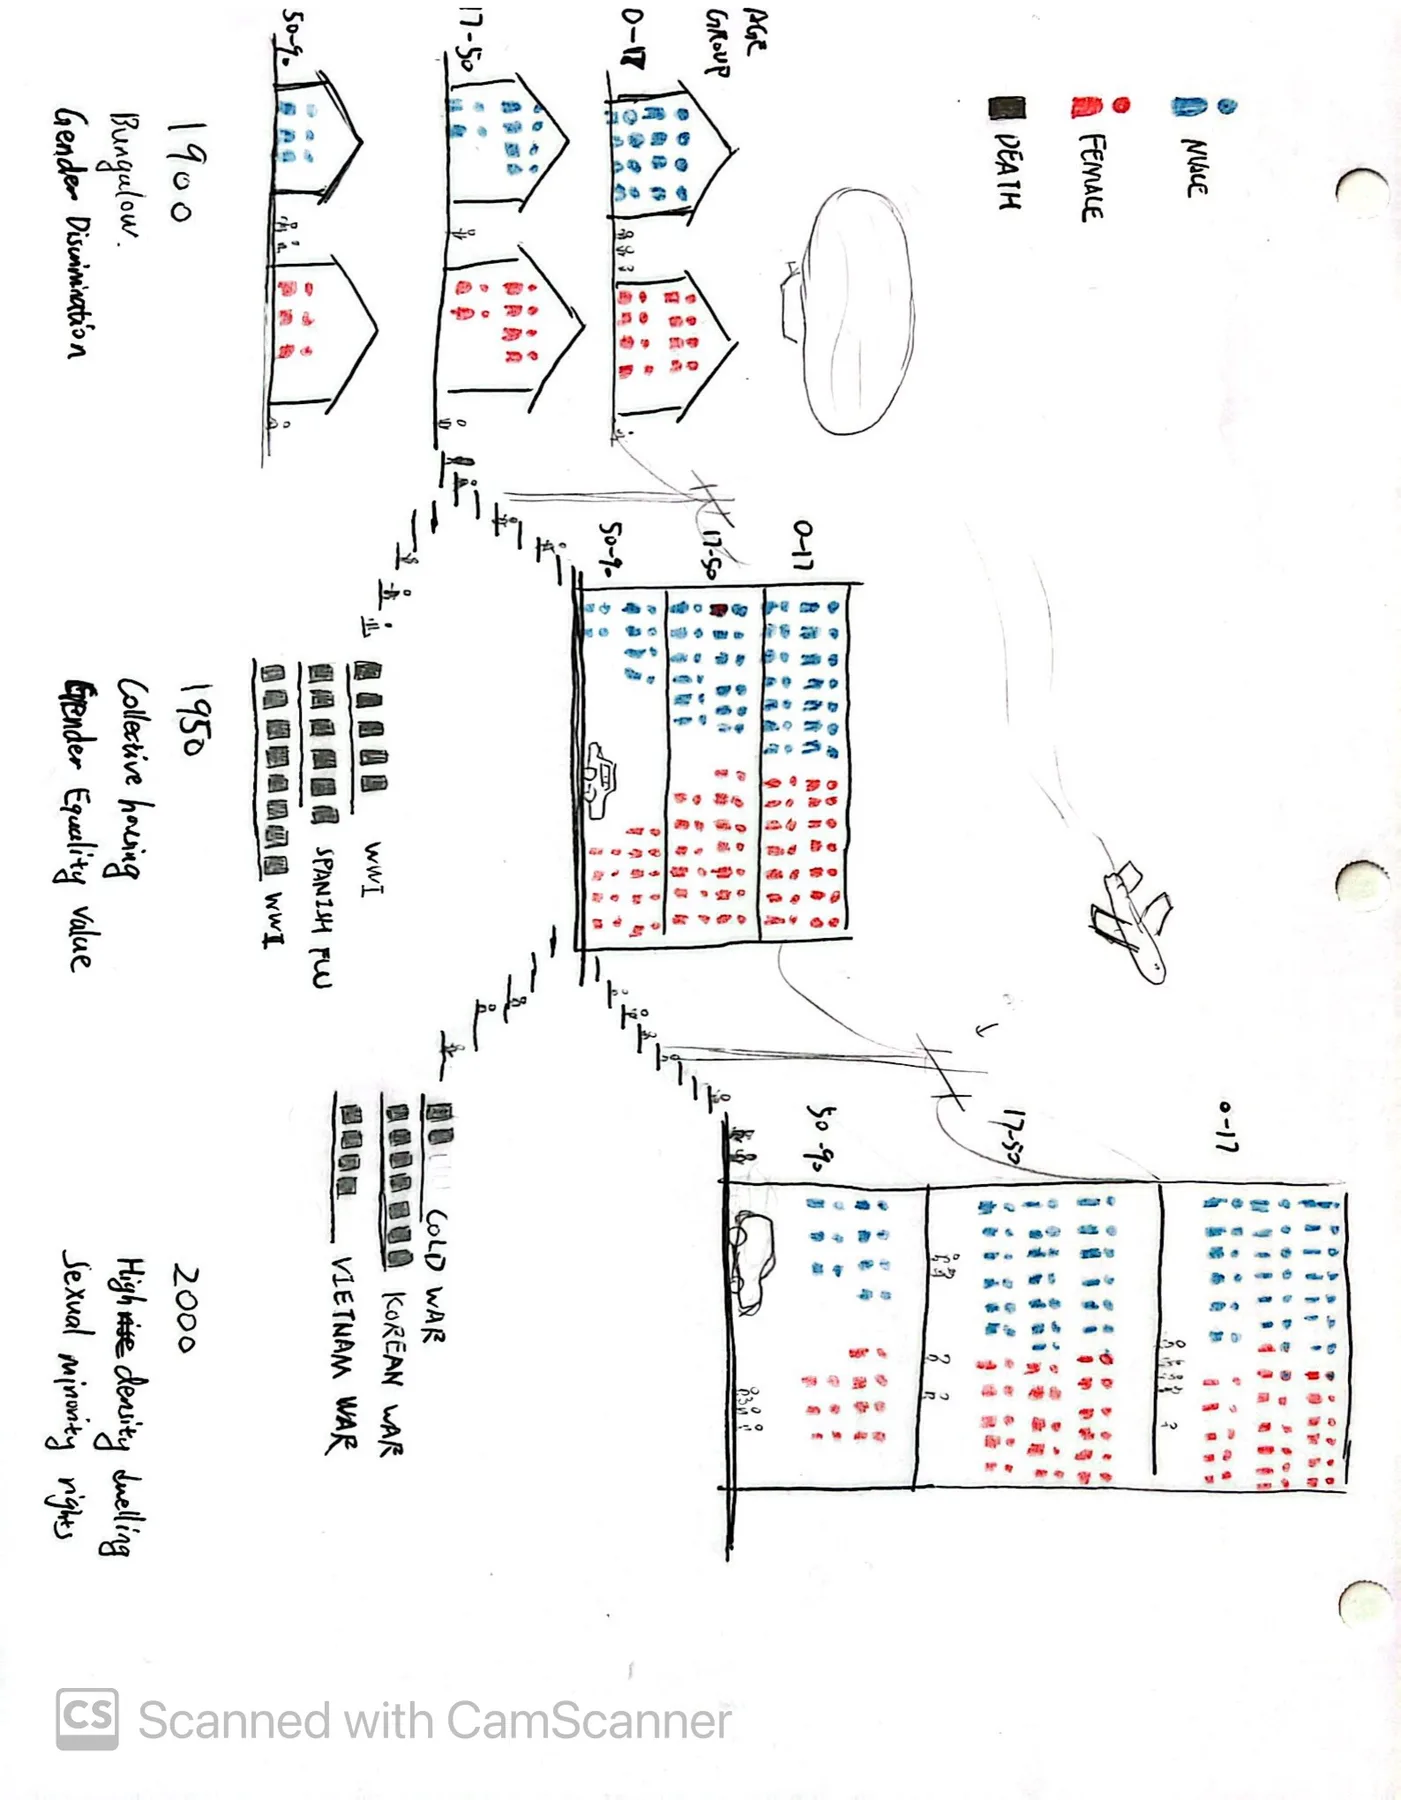
Sketch 2: Narrative Manga
Uses storytelling to show changes in lifestyle, dwellings, and urbanization.
Sketch 3: Pinball Concept
The winning concept that balances expression accuracy with engagement.
Design Decisions
Layout and Color
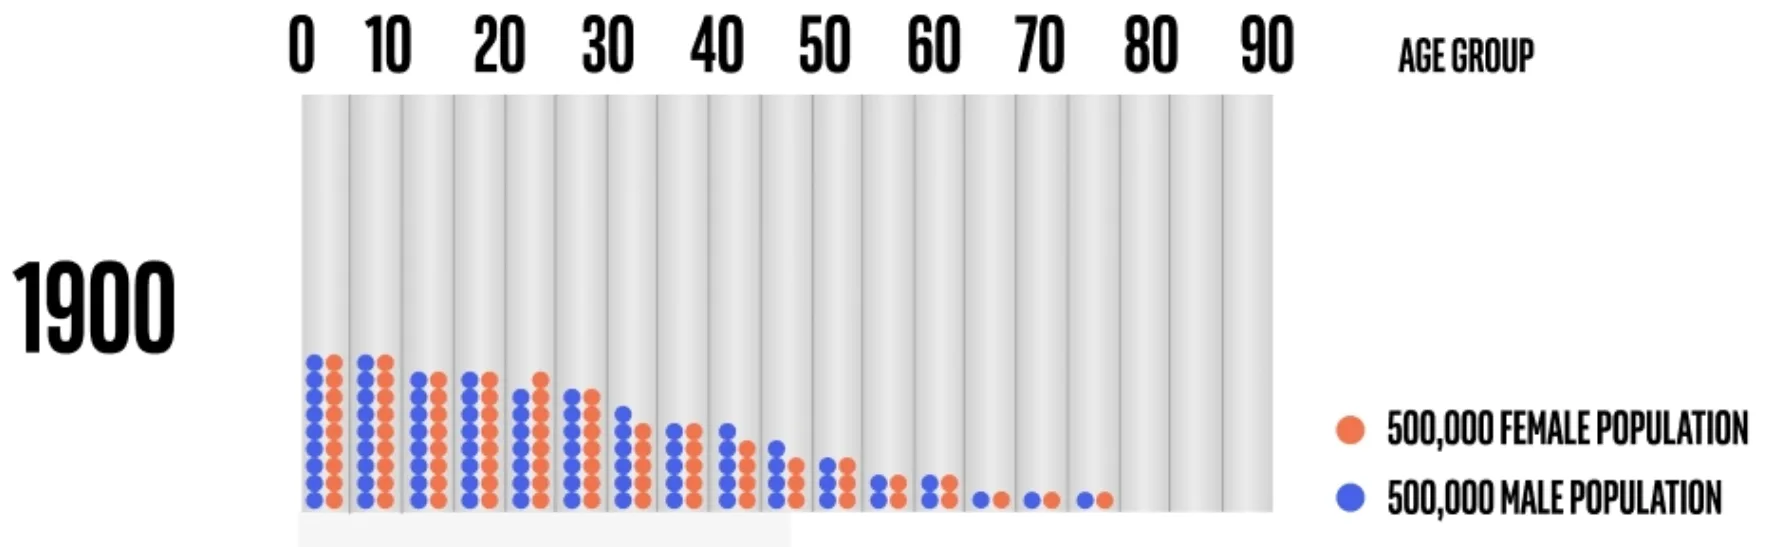
- Orange/Blue Dots: Represent female/male population units (1 dot = 500,000 people).
- Dark Gray Dots: Represent deaths (1 dot = 10,000 deaths).
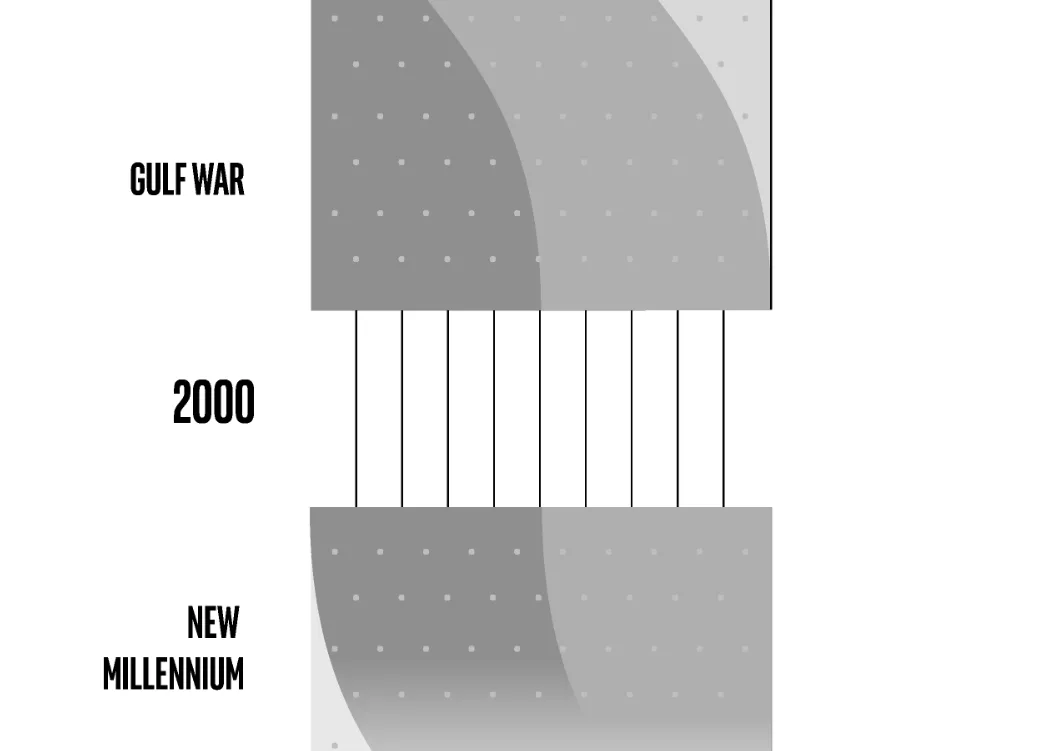
- Shaded Background: Guides the reader through 50-year intervals to indicate population flow.
Intermediate Insights
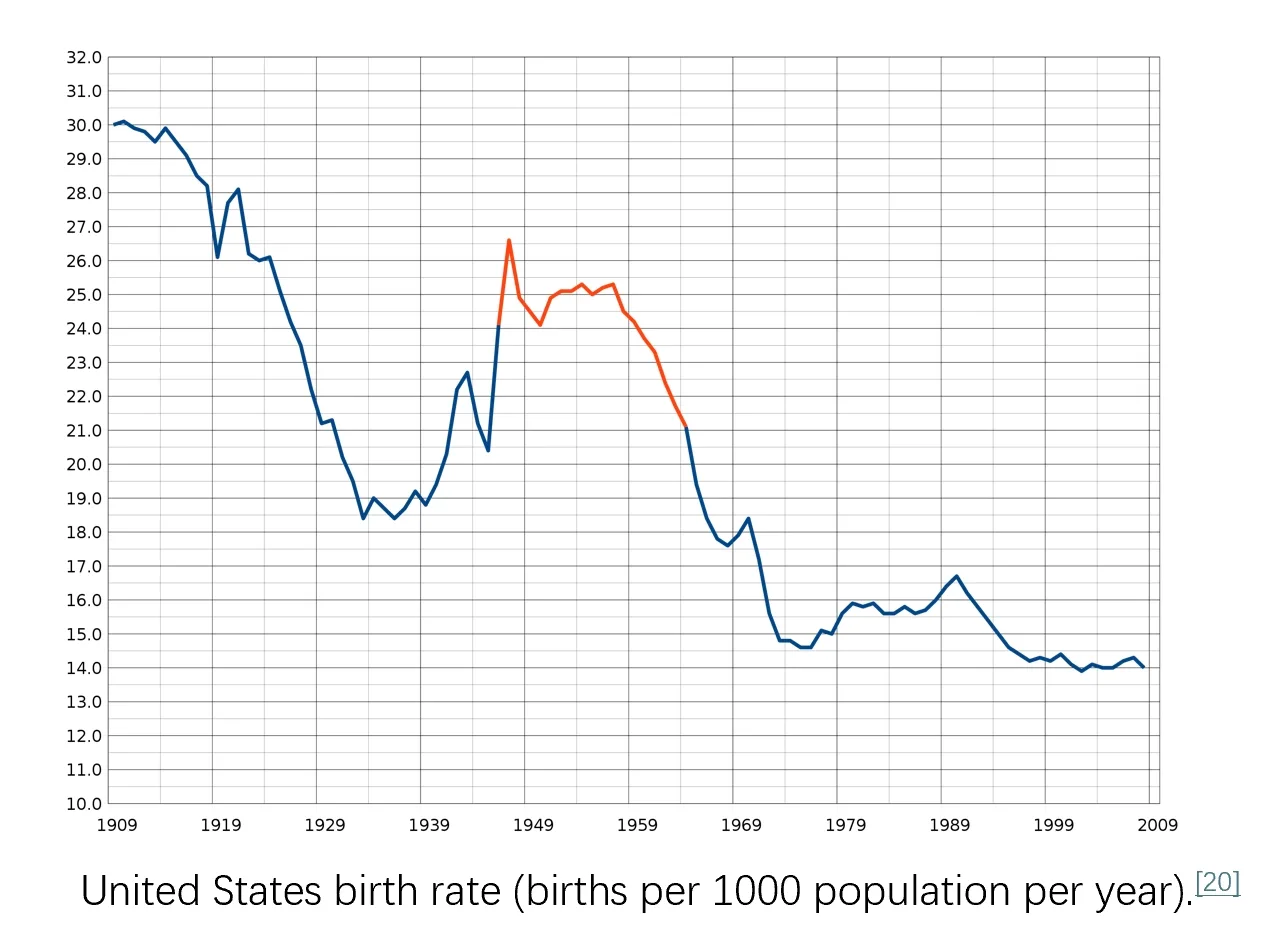
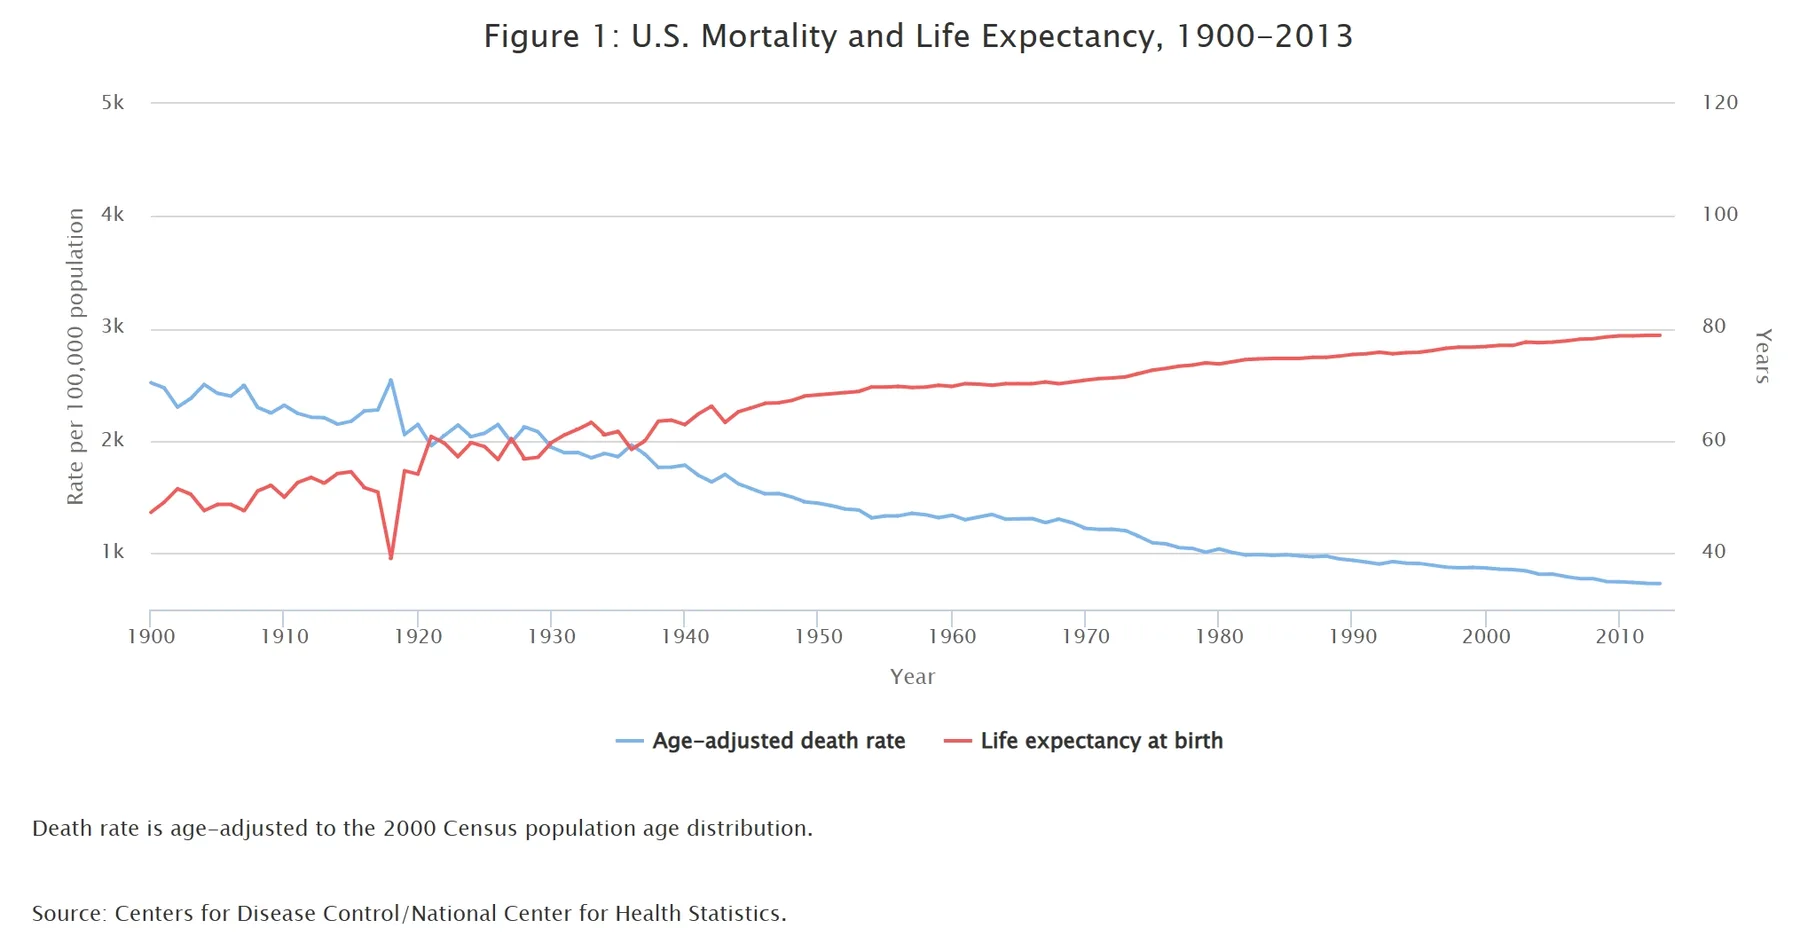
The visualization reveals the stark impact of the Post-War Baby Boom and the unstable mortality rates during the war periods (1910-1940).
Reflection
Sketching greatly stimulated the thinking process beyond default chart styles. The attempt allowed for anticipating the difficulties of manual data cleaning and complex layout design, leading to a more robust final product that balances workload with expressive power.