Design Ethics
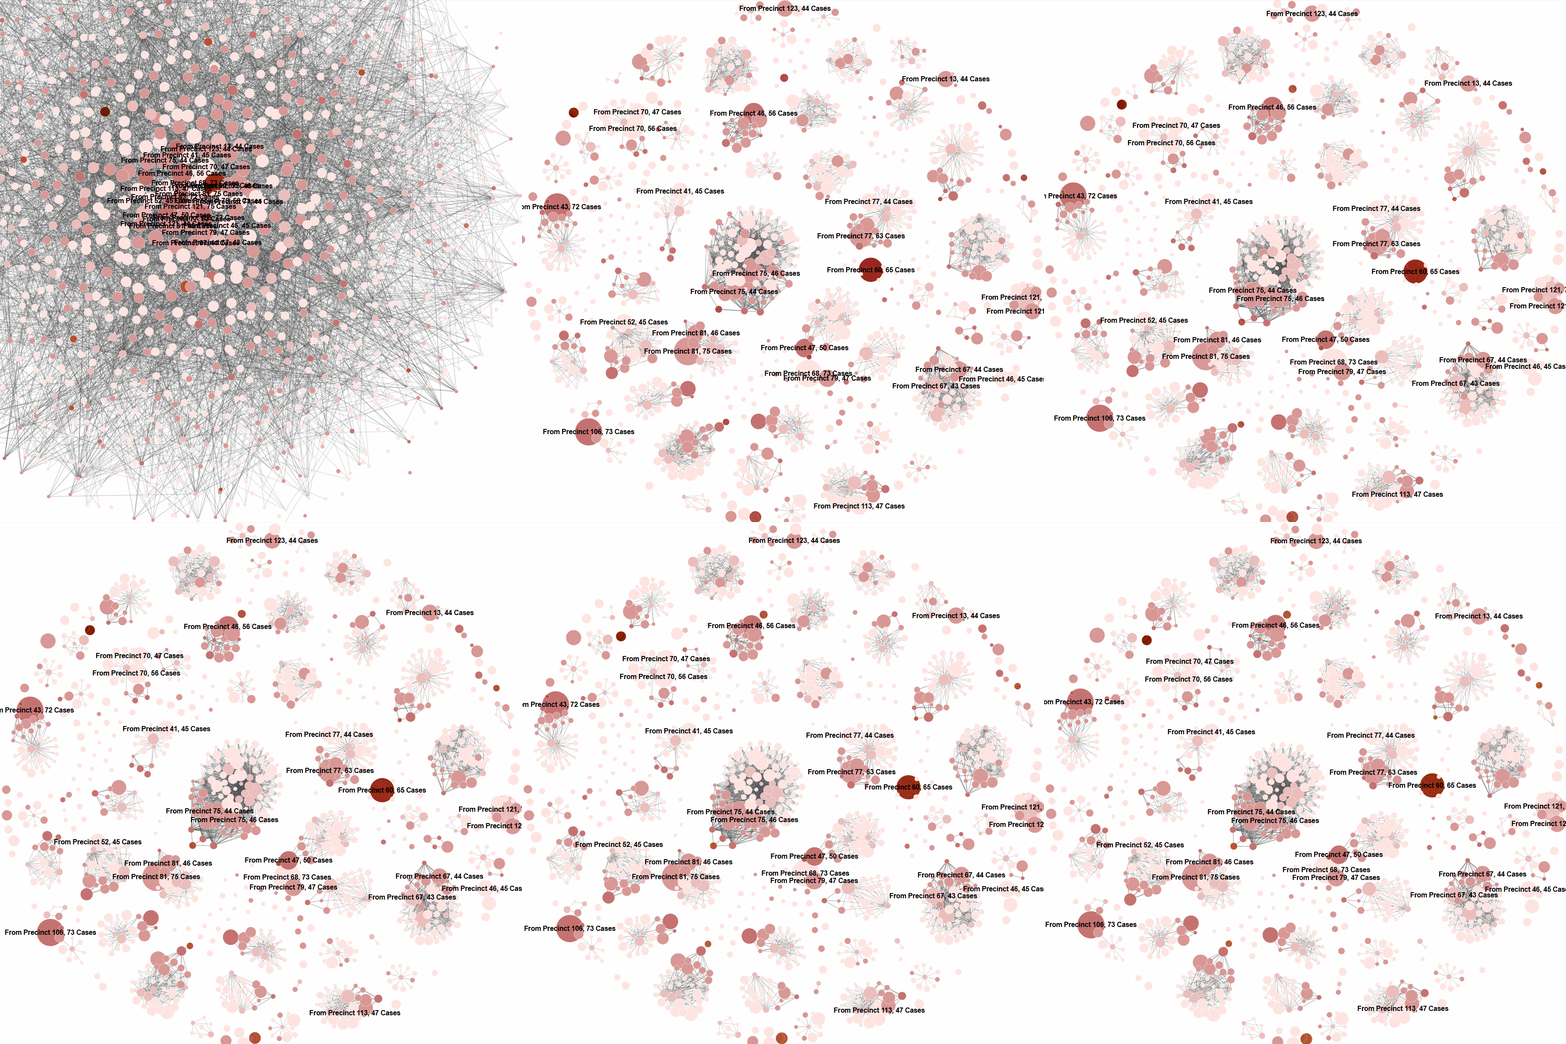
Case Study: New York Police Misconduct
This project explores the profound impact that design and presentation choices have on data interpretation, especially on complex and sensitive social issues. By creating two conflicting visualizations from the same dataset, we examine where "ethical analysis" ends and "misleading" begins.
The Proposition
Is Police Misconduct a Group Practice Influenced by Peer Practices?
The New York police system is a vast interpersonal network. We contrasted two viewpoints:
- Collective: Misconduct is contagious and clustered within specific precinct cultures.
- Individual: Misconduct is isolated and unrelated to social networks.
Design Rationale
1. The Persuasive Path (Clustering & Context)
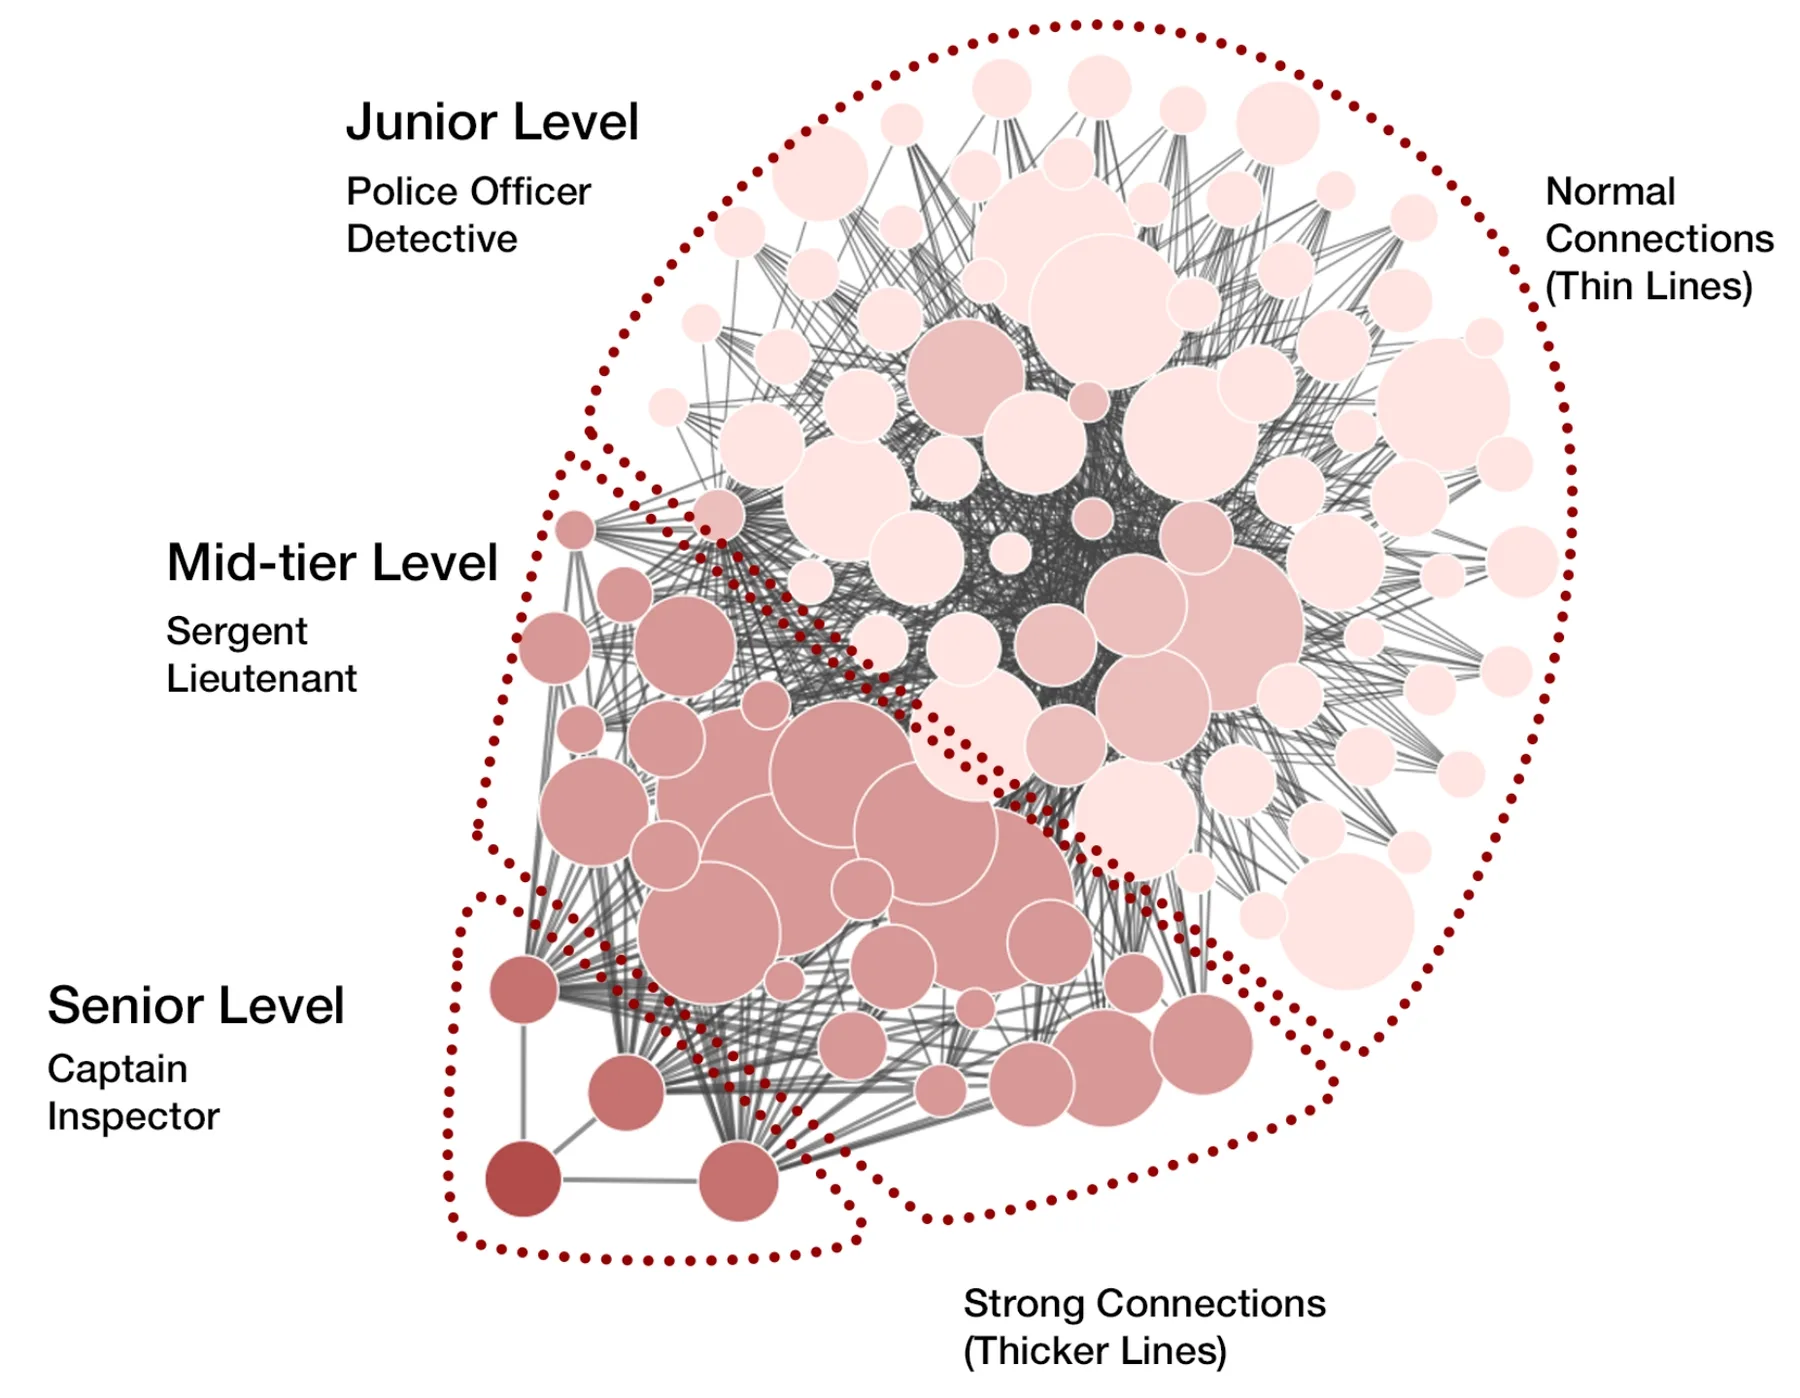
Using a disjointed force chart, we emphasize the "collective" nature of the data.
- Visual Language: Size represents volume of abuse; color represents rank hierarchy.
- Implicit Argument: By clustering nodes by precinct, the design suggests that the immediate environment is a primary factor in conduct.
2. The Deceptive Path (selective Focus)
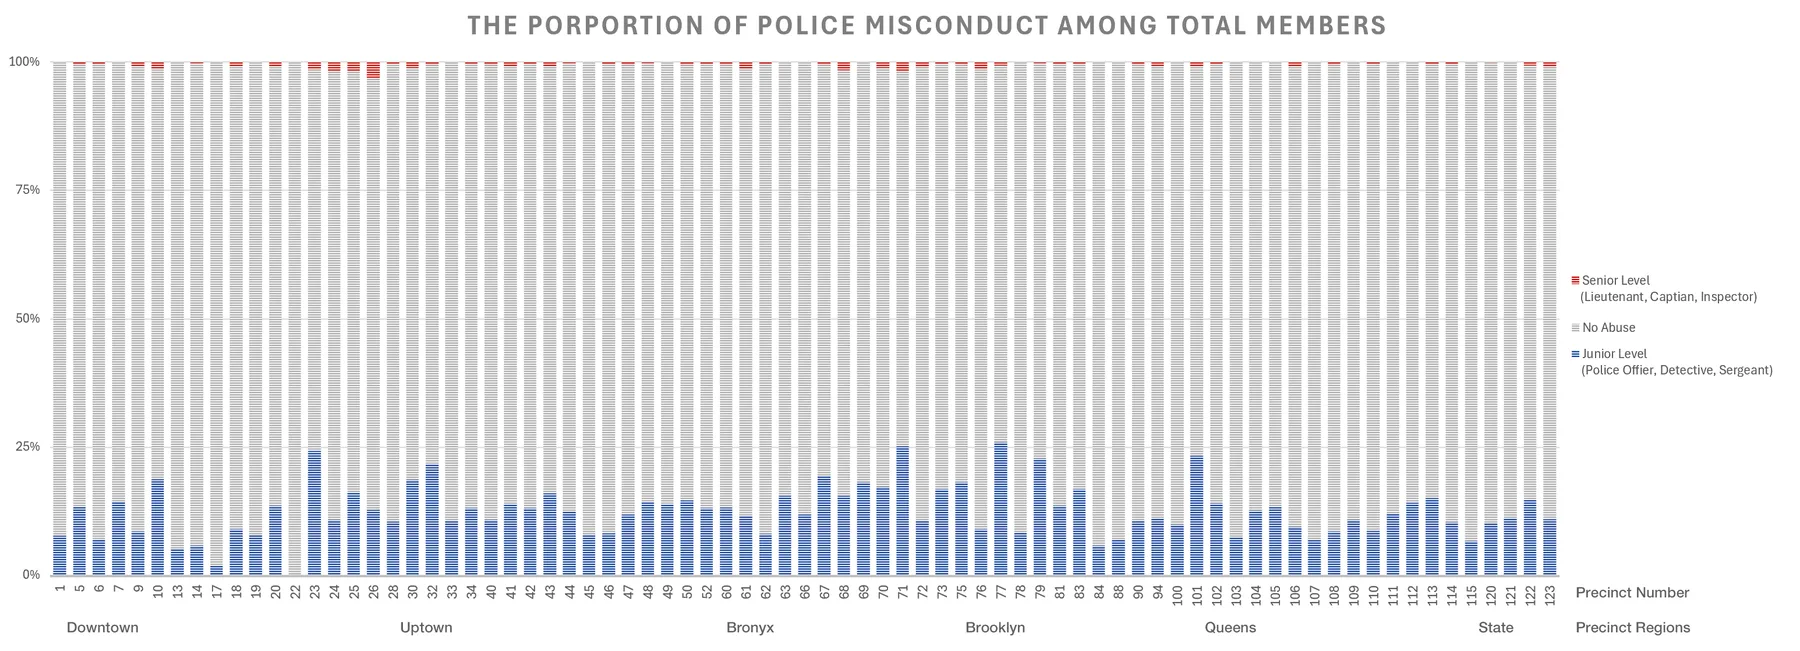
A bar chart designed to misguide the audience into focusing on "innocent" officers.
- Strategic Placement: Placing the "No Abuse" bar at the visual center.
- Misleading Scales: Using percentages instead of absolute values to "dilute" the visual impact of high-misconduct precincts.
- Calming Palettes: Using blues and greys to minimize the sense of alarm.
Final Reflection on Ethics
As data designers, minor adjustments in color, scale, and selective inclusion can drastically shift the narrative. The project demonstrates that "ethical visualization" is not just about having correct data, but about transparency in how that data is framed. Navigating these boundaries is an essential responsibility of the modern designer.